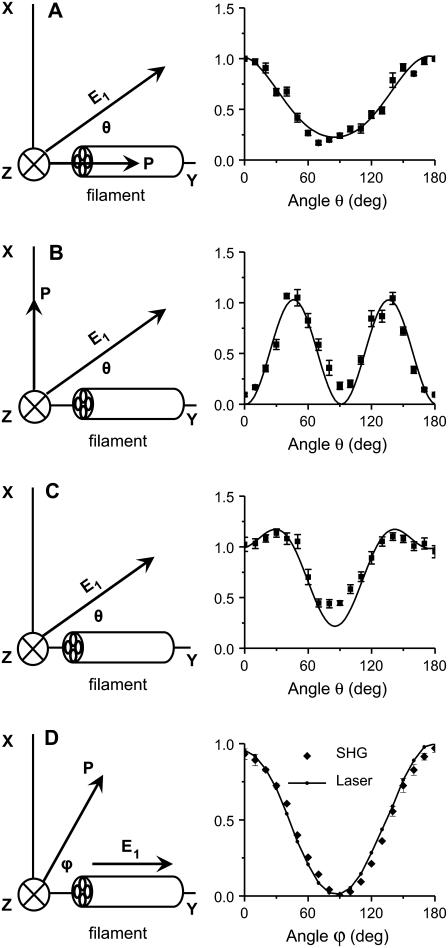
FIGURE 5.
Polarization analysis of forward SHG signal. The scheme of each polarization measurement is shown in the left panel and the result is shown in the right panel. The fiber axis is defined as the y axis and the beam propagation is along the z axis. θ, angle between the excitation field and the y axis; ϕ, angle between the emission polarizer axis and the y axis; E1, excitation field; P, axis of the emission polarizer before the detector. (A–C) Data points are shown as squares with error bars, and solid curves are the theoretical fit. (A) Excitation polarization dependence of the y-polarized SHG component. The least-squares fitting with Eq. 2a gives  where ρ1 =2.13. (B) Excitation polarization dependence of the x-polarized SHG component. The fitting with Eq. 2b gives
  (C) Excitation polarization dependence of total SHG intensity. The fitting with Eq. 1 gives
  where ρ1 =2.13 and ρ2 =1.62. (D) The detected intensity of the y-polarized excitation laser beam (solid curve) and SHG emission (squares with error bars) with respect to ϕ. SHG emission data points indicate that it was also linearly polarized along the y axis. For all measurements, the laser power at the sample was 7 mW. For each data point, SHG intensities from a single fibril were normalized by its peak intensity, and the normalized intensities from different fibrils were used to calculate the mean value and standard deviation. Because the peak intensities of Ix, Iy, and Itotal are at different angles, the amplitude coefficients (0.23, 1.03, and 0.22, respectively) after normalization do not represent Ip,
  and Ip in Eqs. 2a, 2b, and 1, respectively.

