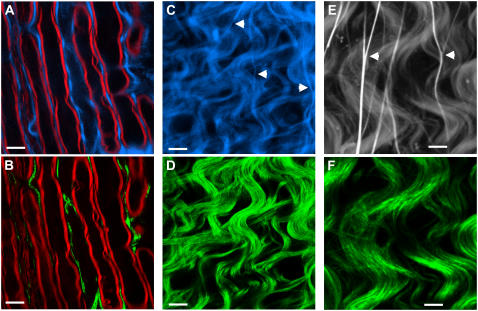
FIGURE 7.
Colocalization of SFG or SHG signal from fibrils (green) and TPEF signal from Ca2+ indicator (blue) or SR101-labeled astrocyte processes (gray) in ex vivo spinal tissues. (A) TPEF image of OG (a calcium indicator). (B) SFG image of the same location as in A. The red in A and B represents the CARS contrast from myelin sheath. (C) TPEF image of the surface of a spinal tissue sample. (D) Simultaneously acquired SFG image of the same location as in C. (E) TPEF image of SR101-labeled spinal tissue. (F) Simultaneously acquired SHG image of the same location as in E. The power used for TPEF and SHG was 8.4 mW at the sample. (A–D) Scale bar, 10 μm. (E and F) Scale bar, 5 μm.

