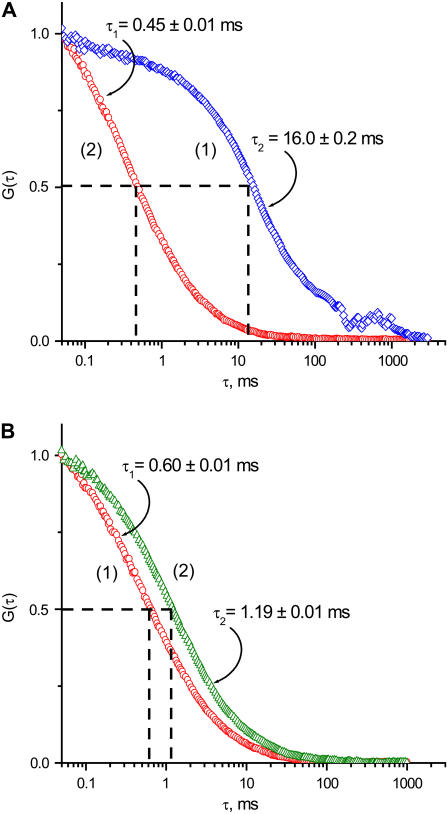
FIGURE 2.
Fluorescence fluctuation correlation functions G(τ) of Cy3 labeled DNA duplexes. (A) FCS functions of labeled DNA duplexes near the surface: Curve 1 (blue diamonds) corresponds to the experiment performed in the presence of anchored SfiI tetramers. Curve 2 (red circles) represents data obtained in the absence of the attached protein. (B) FCS curves acquired from the freely diffusing in solution Cy3-labeled DNA duplexes of different lengths: Curve 1 (red circles), 18 bp; curve 2 (green triangles), 39 bp.

