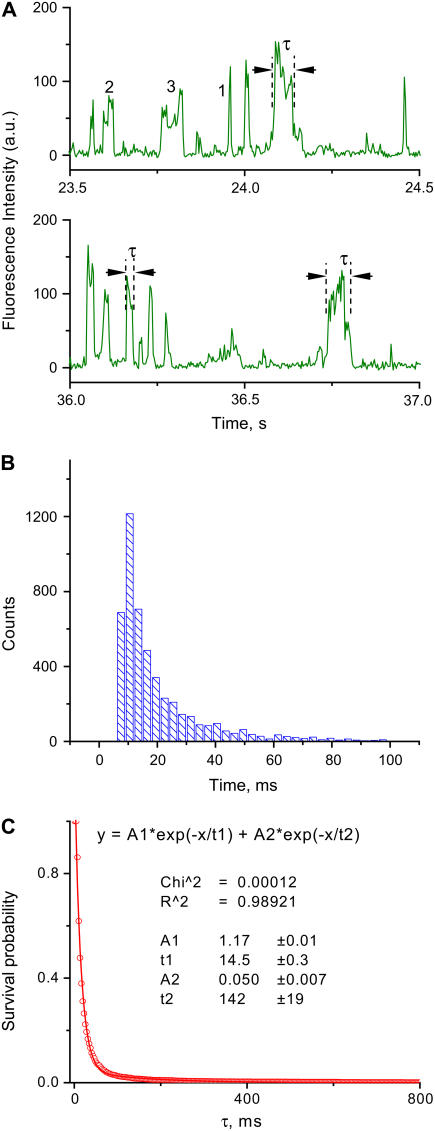
FIGURE 3.
Direct analysis of the time traces obtained for the presynaptic DNA-SfiI complex. (A) Two examples of the fluorescence-intensity time traces selected from the full time trajectory acquired during 10 min of continuous observation. The parameters of all peaks were measured as described in the Methods section; lifetimes τ of three peaks are indicated, for example. Some peaks are marked with the numbers (see text). (B) Distribution of burst durations obtained from multiple time-trace trajectories. (C) Plot of normalized survival probability versus the lifetime of the complex. The characteristic lifetime of 14.5 ± 0.3 ms was determined from the two-exponentials fit as an average lifetime of the most abandoned fraction; ±0.3 is the error of the fit.

