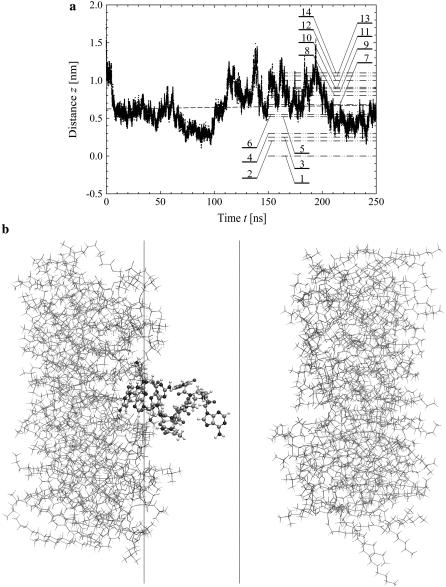
FIGURE 3.
(a) Variation of the distance z between the lipid-water interface and the molecule s-PNA. Dots represent the distance between the molecule and the interface. The dashed lines represent the least square fitting of a straight line to the simulation results over the total time of the simulation. Dash-dot-dot lines represent the mean values of the distance z between the interface and the PNA molecule as well as between the interface and the 14 individual atoms of the molecule calculated during the last 100 ns of the simulations. Numbers correspond to the individual atoms of the molecule listed in the order of growing distance from the interface: 1 – N1′ (C1), 2 – N4 (C1), 3 – N2′ (C1), 4 – O6 (G1), 5 – N2′ (G1), 6 – N4 (C2), 7 – center of the molecule, 8 – N2′ (T), 9 – O6 (G2), 10 – N2′ (C2), 11 – N2′ (A), 12 – O4 (T), 13 – N6 (A), 14 – C1′ (G2) and N2′ (G2). (b) The final configuration of the system. The left and right vertical lines depict the coordinate  and
and  respectively.

