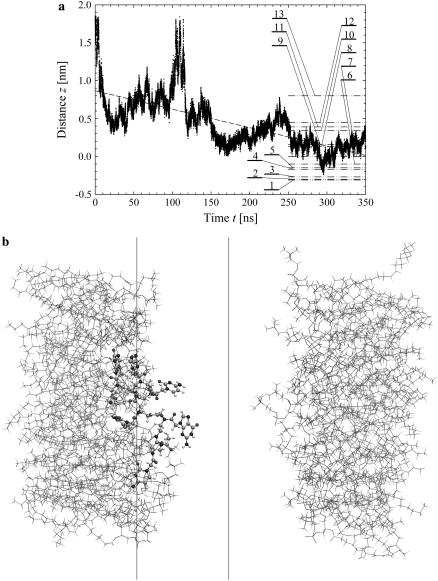
FIGURE 4.
Same as Fig. 3 but for the molecule a-PNA. 1 – O4 (T), 2 – NT (G2), 3 – N2′ (G2), 4 – N4 (C1), 5 – O6 (G2), 6 – CAY (C1), 7 – N2′ (C1), 8 – center of the molecule, 9 – N2′ (T) and N6 (A), 10 – N2′ (C2), 11 – N2′ (A), 12 – N2′ (G1), 13 – O6 (G1) and N4 (C2). Note the systematic drift of the distance z toward the smaller values indicating that the hydrophobic parts of the a-PNA molecule slowly sink into the interface.

