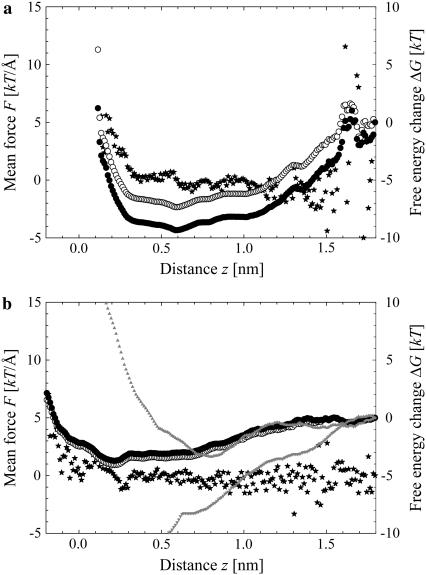
FIGURE 6.
Free energy profile and mean force between the lipid-water interface and the molecule s-PNA (a) and a-PNA (b). Stars denote the mean force, open circles the free energy change calculated using Eq. 1, and solid circles depict the free energy change calculated using Eq. 5. Note large fluctuations of the force and free energy in the plot (a) above the distance  Gray triangles in panel b denote the free energy profiles calculated with Eq. 1 when ABF is applied. These two profiles correspond to adsorption (
 ) and desorption (
 ) of a-PNA molecule.

