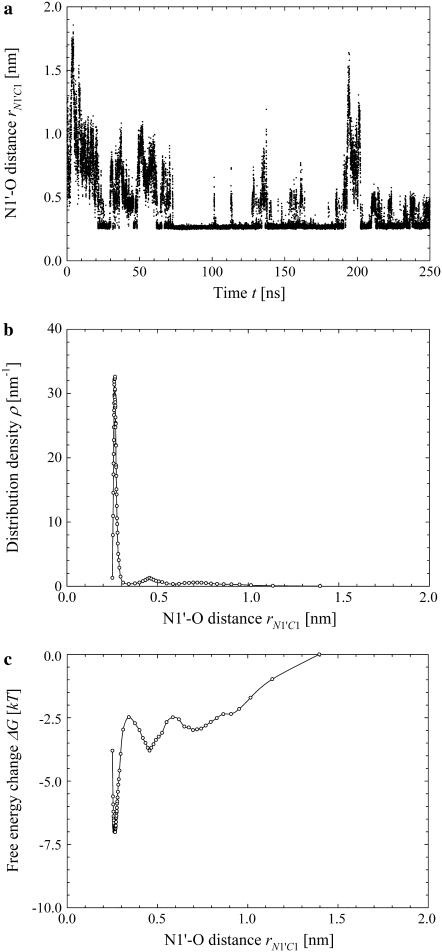
FIGURE 7.
Simulation results for the hydrogen bond between the hydrogen atoms of the standard N-terminus and the oxygen atoms of the lipid phosphate groups. (a) Time evolution of the distance rN1′C1 between the terminal nitrogen atom N1′ of the molecule s-PNA and the nearest oxygen atom O3 or O4 of the lipid phosphate groups; 250 ns of the time evolution is represented by 31,250 measurements of the distance rN1′C1 at each 8 ps. The intervals ΔrN1′C1 are chosen in such a way to keep the number of the rN1′C1 measurements per interval constant and equal to  except the last interval where
  The reported values of the distance rN1′C1 represent the average values calculated for each of the intervals. (b) Distribution density ρ of the distance rN1′C1 between the terminal nitrogen atom N1′ of the molecule s-PNA and the nearest oxygen atom O3 or O4 of the lipid phosphate groups. The distribution density was calculated using Eq. 2. (c) Change of the system free energy ΔG as a function of the distance rN1′C1 between the terminal nitrogen atom N1′ of the molecule s-PNA and the nearest oxygen atom O3 or O4 of the lipid phosphate groups. The free energy change was calculated with Eq. 4 and the distribution density at the largest distance
  was used as the reference value. Note the deep primary minimum at the distance
  when the N-terminus nitrogen atom is separated from the nearest oxygen atom with a single hydrogen atom, as well as the three successive minima of decreasing values, located at the distance rN1′C1 equal to 0.46, 0.70, and 0.91 nm, corresponding to the system configurations in which the N-terminus is separated from the lipid-water interface with one, two, and three water molecules.

