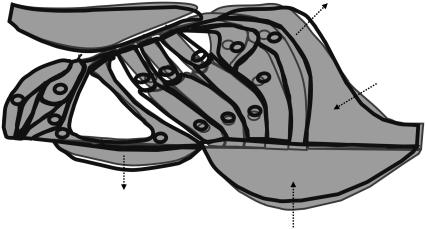
FIGURE 17.
Schematic drawing showing the radial view of the OC. The OC is shown in two states: at rest (gray lines) and at maximum contraction (black lines). The cartoon summarizes our findings of how the OC moves at low frequencies (∼2–6 octaves below CF; details in text). All motions have been exaggerated for visualization purposes.

