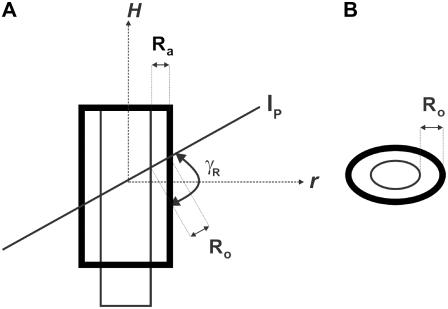
FIGURE 18.
(A) Schematic drawing of an OHC's radial cross section. The cell is shown at rest (thin lines) and at maximum contraction (thick lines). H, vertical axis, in this case parallel to the long axis of the cell, generally considered to be the axis parallel to the optical axis; r, radial axis; Ra, actual radial displacement; Ro, observed radial displacement; all other acronyms as defined in Fig. 6 B. Surface view of the OHC at rest (thin lines) and at maximum contraction (thick lines).

