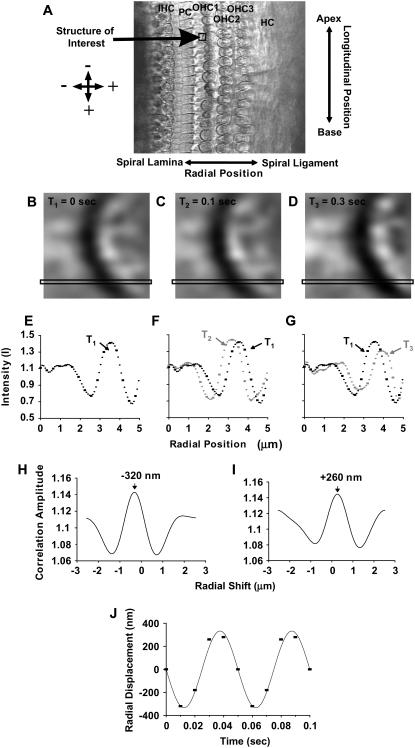
FIGURE 4.
(A) High-magnification surface view of the OC captured with our video stroboscopy system at one particular phase of the stimulus (exp. 131). Several structures of interest are shown: the basal end of IHCs, the head of the pillar cells (PC), the three rows of OHCs, and the area of the HC. In all our images, the radial dimension is from spiral lamina to spiral ligament and the longitudinal dimension from base to apex. Radial motions toward the spiral ligament and longitudinal motions toward the base are positive by convention. To estimate these motions, a portion of the image containing a feature of interest like the edge of a hair cell was extracted from each of the eight phases and the corresponding no-stimulus conditions. For simplicity, we present the analysis for three time points. (B–D) Shown are three time frames of the edge of an OHC. Each panel is a matrix of 16 × 16 pixels (432-nm resolution). For illustration purposes, the analysis is shown for one row of pixels (illustrated in each time frame), but during motion estimation the analysis is done for the entire extracted image. (E–G) The intensity of each pixel across one row is plotted as a function of radial position (solid squares). Note that the shape of the intensity profile could be similar (but not identical) from one time frame to the next but shifted with respect to the radial position. The next step was to quantify this shift. Because the motion of interest was usually less than a pixel, interpolation was used (solid circles between squares). The resulting images had a resolution of 27 nm/pixel. (H and I) Cross-correlation computed with fast Fourier transforms was used to quantify the shift that yields the best fit between two images. For the curves shown in E and F, the best fit was at a shift of 320 nm toward the left and for the curves in E and G, the best fit was at a shift of 260 nm toward the right. (J) Cross-correlation was repeated for all the stimulus phases to derive the time waveform of the displacement shown by the squares. Fourier analysis was then performed on the time waveform and from the fundamental component we estimated the peak amplitude and phase of motion for each stimulus frequency.

