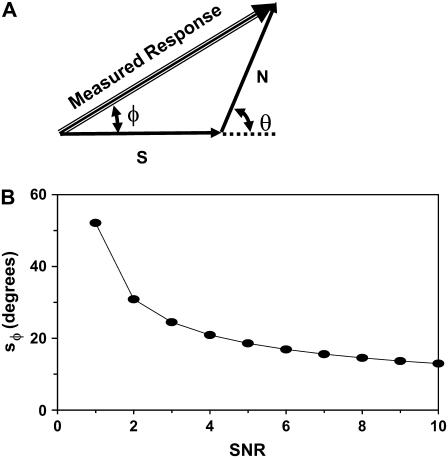
FIGURE 5.
Estimation of the SNR from the standard deviation of the phase of our measured response. (A) The measured response is the vectorial sum of the signal (S) and a randomly varying noise (N). The magnitude and the phase (φ) of the measured response depend on the phase of the noise (θ). (B) Standard deviation of φ (sφ) as a function of SNR.

