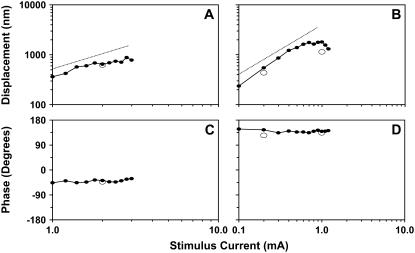
FIGURE 8.
Peak-to-peak magnitude and phase of radial displacements as a function of stimulus current. The stimulus frequency was 120 Hz. Dotted line has unity slope. (A and C) Responses from an apical turn OHC1 (OHC1b, exp. 615). (B and D) Responses from a middle-turn OHC3 (OHC3a, exp. 614). Note that the current axis ranges from 1 to 10 mA in A and C, and from 0.1 to 10 mA in B and D. Repeated measurements (∼25 min later, open circles) were used to evaluate the effect of time on OHC responses.

