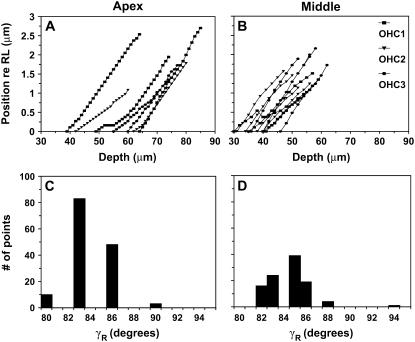
FIGURE 9.
Measurements to estimate γR in the apex (exp. 1008, CF ∼0.4 kHz) and middle turn (exp. 1011, CF ∼4 kHz). (A and B) Peak radial displacement of individual OHCs from each of the three rows as a function of depth from the RL to the BM. The displacements are positive, indicating that as we focused lower into the organ the cells shifted toward the spiral ligament. Due to the large longitudinal tilt in this experiment, the cells came into focus at different focal levels, and hence the extractions do not all start from the same focal level. In general, extractions from the middle-turn experiments span fewer levels, since the OHCs in this turn are shorter than those from the apical turn. (C and D) Histogram of the angles calculated from A and B (see text).

