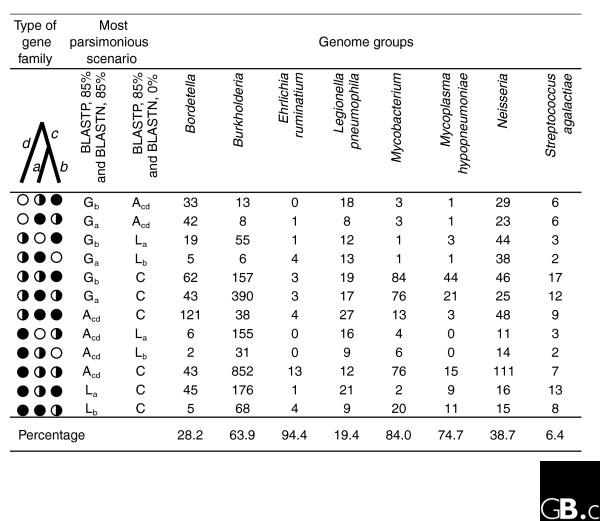
Figure 2.

The analysis of patchily distributed gene families that change their state (present or absent) in different genomes under two different selection criteria for gene families. Eight groups of three genomes each were analyzed. In one selection scheme, a match-length requirement of 85% in BLASTN was imposed (stringent selection), while in the other there was no match-length requirement in BLASTN (relaxed selection). Corresponding gene families constructed under the two criteria were compared and classified into all possible types of gene families (total 33 = 27). Of these, only those types of gene families (12) where at least one gene is present under both criteria, and where at least one gene changes its state under the two criteria, are shown. They are coded as filled circles (present under both criteria), empty circles (absent under both criteria) and half-filled circles (absent under the stringent criterion and present under the relaxed criterion). Numbers in the figure indicate the number of patchily distributed gene families that change their state when under two different selection criteria. The last row is the total number of gene families for which differences in history might be incorrectly inferred, expressed as a percentage of total gene families detected as present in one or two, but not three, genomes in a genome group. The total number of gene families used in the calculation is listed in the second table in Additional data file 2. Branches on the three-taxon tree are denoted as a, b, c and d. G, gain; L, loss; A, ambiguous (both gain and loss are equally parsimonious); C, core (that is, present in all three genomes). The subscript refers to the branch on which the event is inferred. For the list of genomes in each group see Additional data file 3.
