
Figure 4.
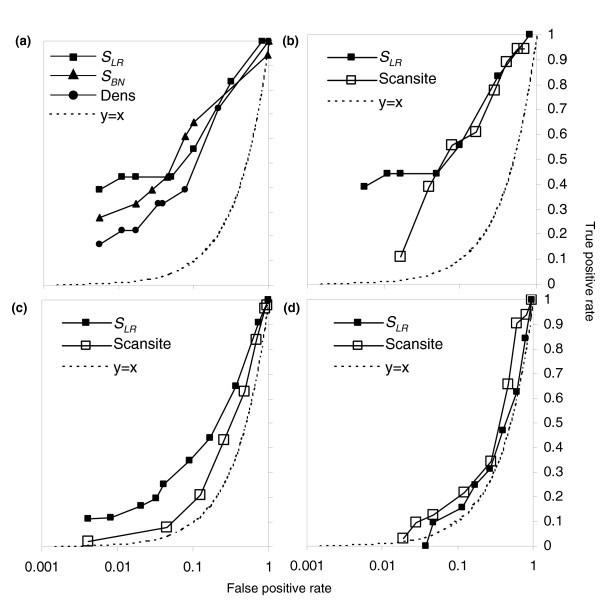
ROC curves for prediction of CDK substrate proteins. (a) Comparison of classifiers suggests that cluster based methods SLR and SBN (filled squares and triangles, respectively) perform better than the density of strong matches (filled circles). (b-d) comparison of cluster-based method SLR (filled squares) with Scansite, a matrix-based method (unfilled squares). See text for details. Plotted is the fraction of positives versus the fraction of negatives passing as the threshold is varied in the three datasets a, b ('unbiased' proteins, which were randomly chosen), c ('2+' proteins, which contain two or more matches to the strong CDK consensus), and d ('1cc' proteins containing one match to the strong CDK consensus and whose transcripts exhibit cell-cycle regulation). Note that the unlike conventional ROC curves, we plot the false-positive rate on a log scale, such that the expectation for a random predictor no longer falls on the diagonal. The expectation for a random predictor is indicated in each panel by the dotted trace. CDK, cyclin-dependent kinase; ROC, receiver operating characteristic.