
Figure 7.
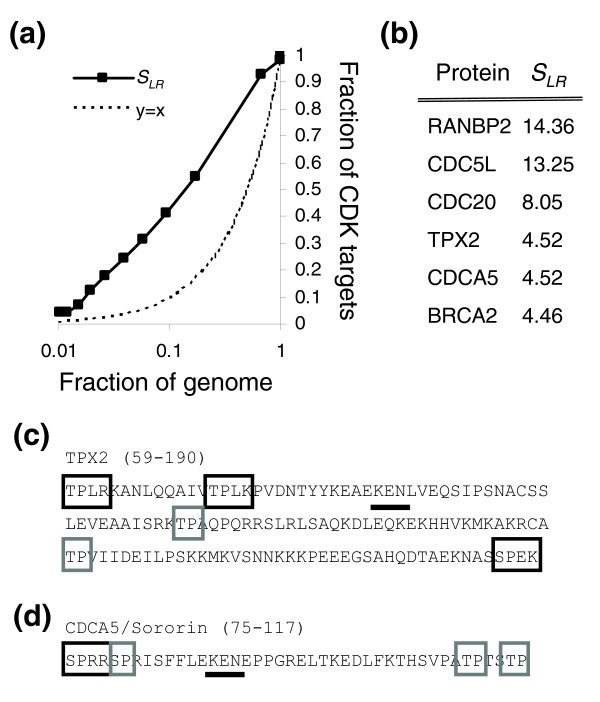
Predicting CDK targets in the human genome. (a) The fraction of proteins in known human CDK targets versus the fraction in the human genome (black bar) as the cutoff is varied. (b) Genes with clusters scoring more than 3.5 from a list of human cell-cycle genes. See text for details. (c,d) The K-E-N box (black underline) degradation signals in TPX2 (panel c) and Sororin (panel d) are found among clustered consensus matches. The entire optimal clusters are not shown. Strong and weak consensus matches are indicated by black and grey boxes, respectively. The regions of the protein shown are indicated in parentheses. CDK, cyclin-dependent kinase.