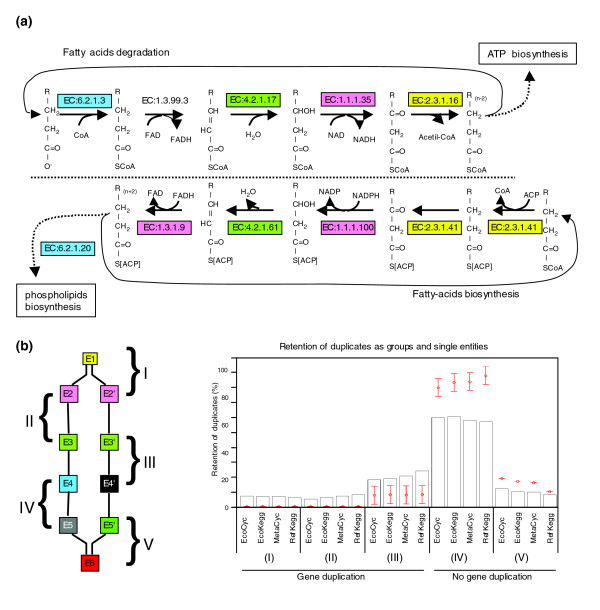
Figure 4.

Retention of duplicates as groups and single entities. (a) The fatty-acid degradative and biosynthetic routes illustrate the retention of duplicates as groups. The same colors in EC number boxes denote duplicates. (b) Retention of duplicates acting consecutively. Five hypothetical scenarios were analyzed (left panel). Boxes of the same color denote duplicates. The number and letter (for example, E2 and E2') indicate the place of the reaction in the series. Scenarios (I) and (V) have a common reaction followed or preceded by two possible reactions. In (I) gene duplication was detected, in (V) it was not. Scenarios (II), (III) and (IV) involve pairs of consecutive reactions in two branches of the network. In (II) both pairs are duplicates, in (III) only one pair is duplicated, and in (IV) none of the pairs are duplicates. From this diagram one can see that one pair can participate in more than one scenario, looking upstream or downstream in the network flux. The histogram on the right shows the frequency for each scenario. We present the results for the four databases analyzed herein. The networks were reconstructed eliminating the top 20 hubs. These results are the comparison of all-against-all pairs (EC:a.b → EC:w.x), including CSRs as well as CDRs. Red dots represent the expected average frequencies ± 3σ obtained using Maslov-Sneppen models.
