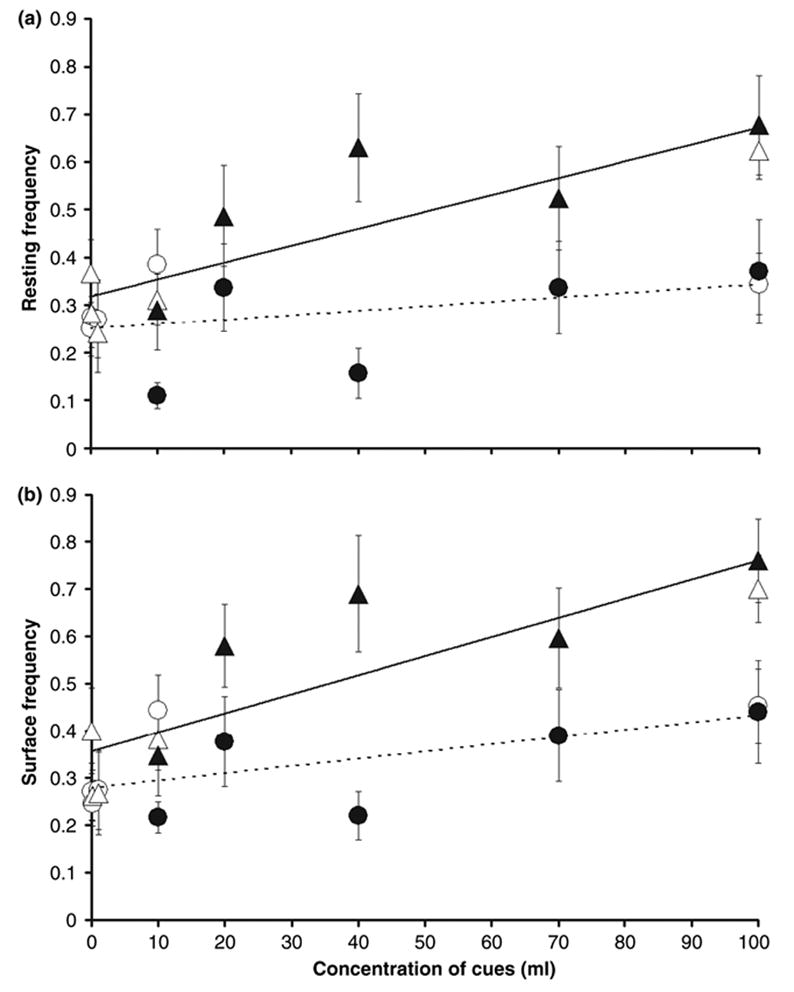
Fig. 1.

(a) Means (±SE; total number of larvae observed per concentration n = 8–10 each) of resting frequency for each treatment-concentration combination, plotted against the concentration of cues for both runs combined. (b) Means (±SE; n = 8–10 larvae each) of surface frequency for each treatment-concentration combination, plotted against the concentration of cues for both runs combined. Triangles = predation; circles = control. Open symbols = run 1; Closed symbols = run 2. Dotted trend lines = control treatments; solid trend lines = predation treatments. The points that appear to be on the vertical axis for both resting and surface range from 0.01% to 1%. The open figures which represent run 1 are clustered near the origin of the graph, except for one point at 100% concentration. The points of the two runs overlap only at 100% and 10% concentrations. The equations are: resting control y = 0.0009x + 0.0251 (R2 = 0.1702), resting predation y = 0.0035x + 0.3192 (R2 = 0.7582). Surface control y = 0.0015x + 0.279 (R2 = 0.4163), surface predation y = 0.0040x + 0.3569 (R2 = 0.7553)
