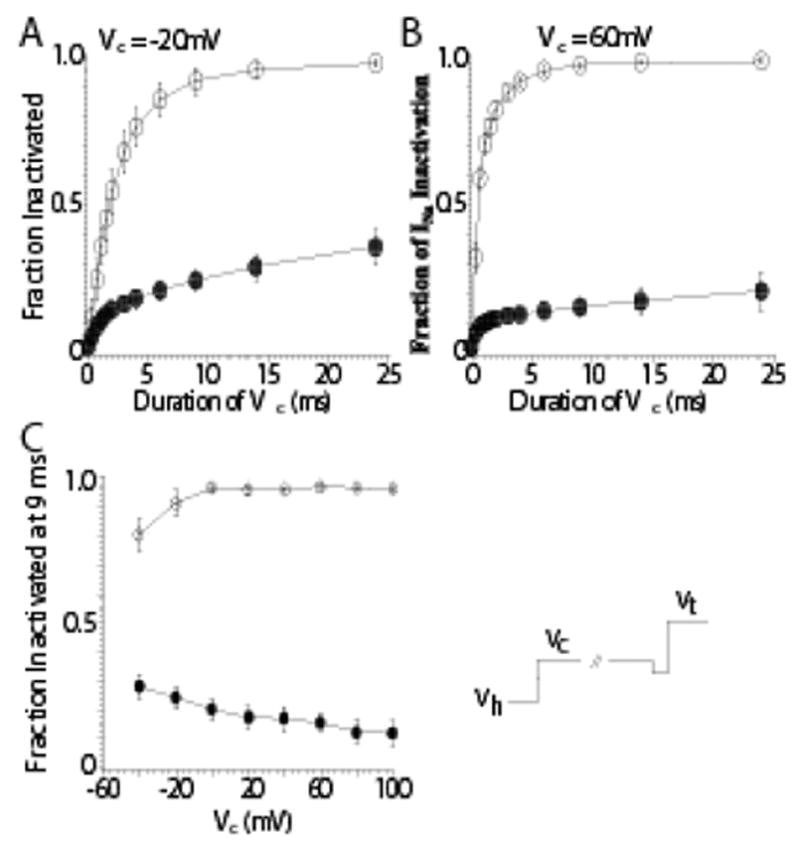
Figure 3.

Inhibition of Inactivation from the Open-State after Anthopleurin-A Modification. Shown are two-pulse development of inactivation protocols at more positive conditioning potentials in control (○) and after modification by Ap-A toxin (●;). The voltage protocol (bottom right) is similar to that shown in the previous figure. Prior to stepping to the conditioning potential there was a brief voltage step to −40 mV for 0.2 ms. Peak INa measurements were normalized to the peak INa measured in the absence of a conditioning step. Panel A: At a conditioning potential of −20 mV INa had inactivated by 92% within 9 ms in control solution, but only by 24% after Ap-A toxin. Panel B: At a conditioning potential of 60 mV, 95% of the peak INa had inactivated at 9 ms in control while only 16% had inactivated after Ap-A toxin. Panel C: The mean fraction of INa inactivated by 9 ms as a function of potential in control (○) and after Ap-A toxin (●). Note that inactivation became more complete at positive potentials in control solution, while after Ap-A toxin there was less inactivation at positive potentials compared to negative conditioning potentials. From Hanck and Sheets, 1995 with permission.
