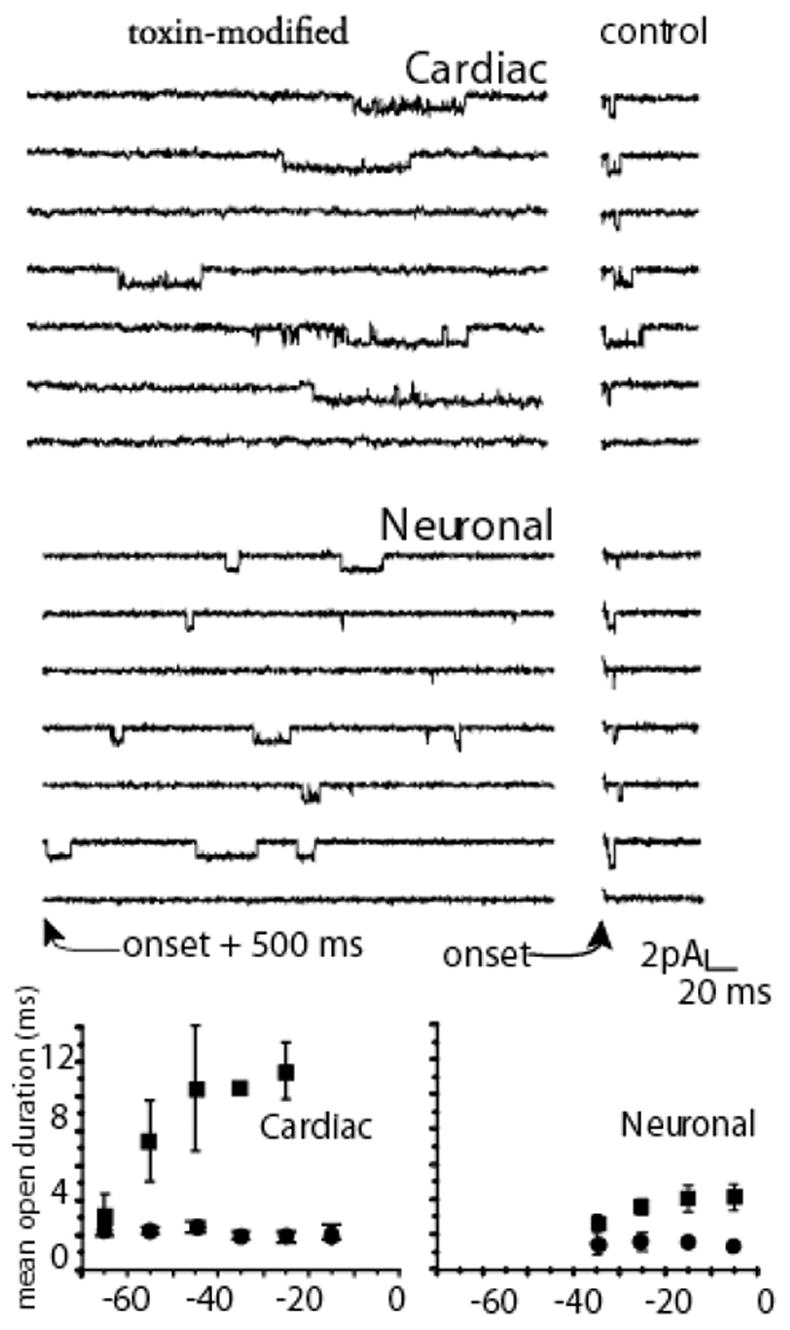
Figure 4.

Mean Channel Lifetime. Upper panels show cell attached single channel recordings with 280 mM Na at 6 C. Right panels shows control (measured immediately after the onset of a step depolarization to −10 mV) in cardiac and neuronal channels. Left panels show records with 1 μM Ap-B in the pipette in which recordings are shown beginning 500 ms after the depolarization. Bottom panels show mean open durations measured from amplitude histograms for multiple patches measured at the potentials indicated. Data analysis techniques are completely described in Benzinger et al., 1999. Mean open time was prolonged by toxin in both isoforms, although more dramatically for cardiac than for neuronal channels.
