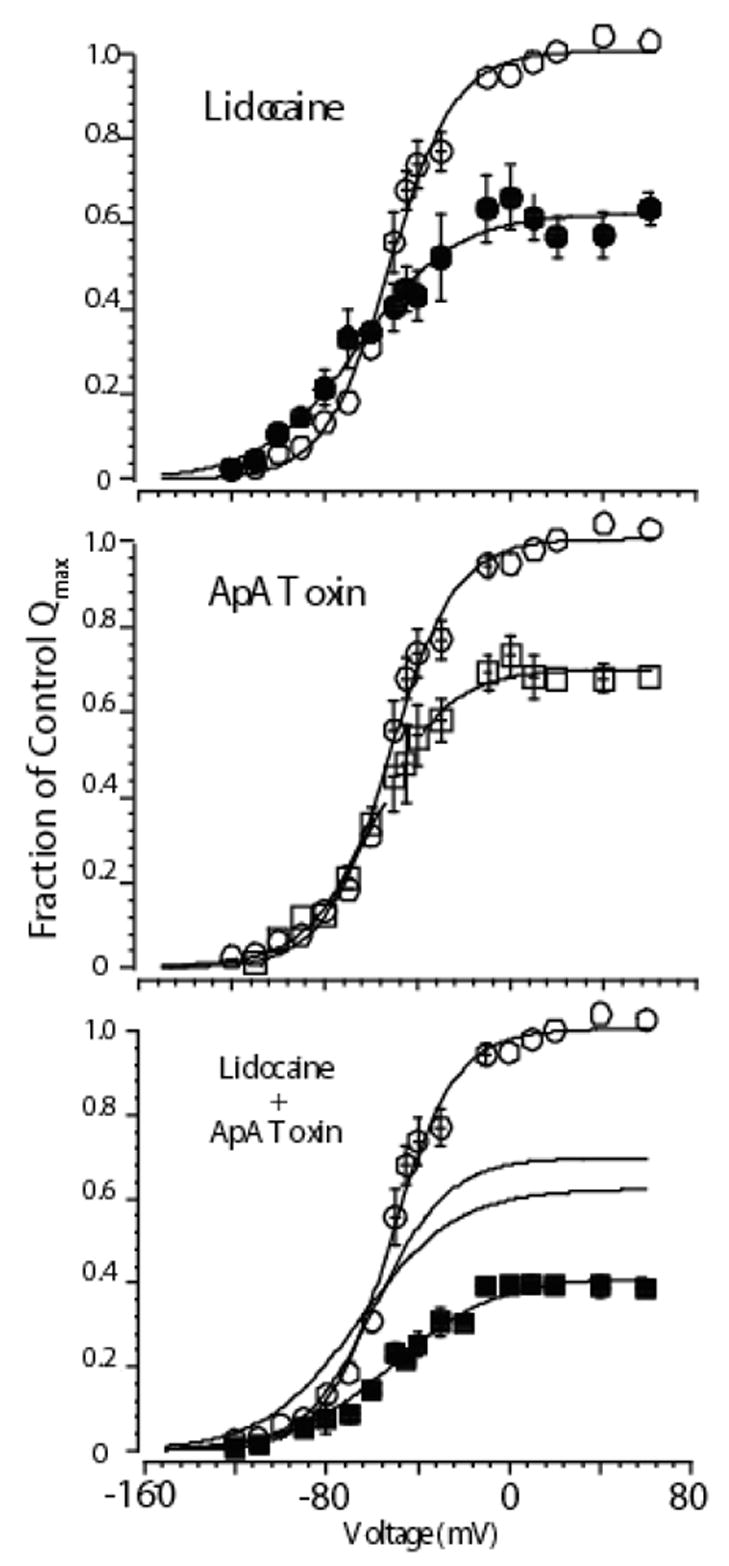
Figure 6.

Mean charge voltage relationships for cells expressing cardiac Na channels exposed to high concentrations of either lidocaine alone (upper panel), Ap-A alone (middle panel), or both agents together (bottom panel). In each panel open circles show control data. Lidocaine modified data are shown as filled circles, Ap-A toxin modified data as open squares, and when both agents were present as filled squares. Solid lines are Boltzmann fits to the data. When both agents were present the effect on Qmax was additive, which can be appreciated from inspection of the fitted lines from each agent alone, which are also graphed in the lower panel. Interestingly, when both agents were present the Q-V relationship did not shift leftward as it did with lidocaine alone (see Hanck et al., 2000). Subsequent experiments determined that the gating charge responsible for the leftward shift in lidocaine is located in domain IV, the same gating charge that does not move when site-3 toxin is bound (Sheets & Hanck, 2003). Modified from Hanck et al., 2000.
