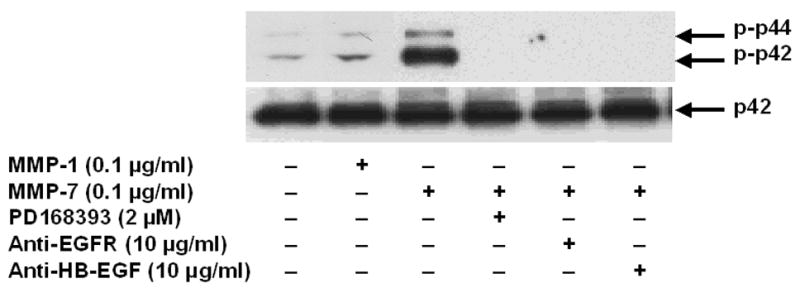
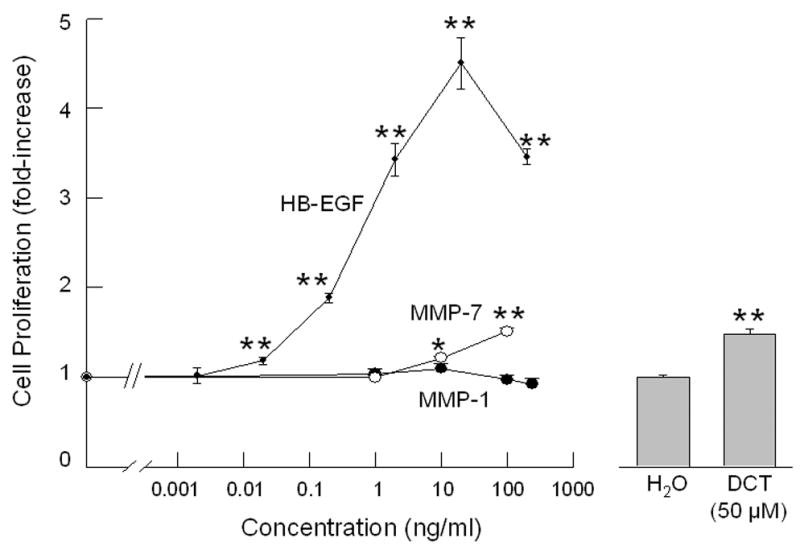
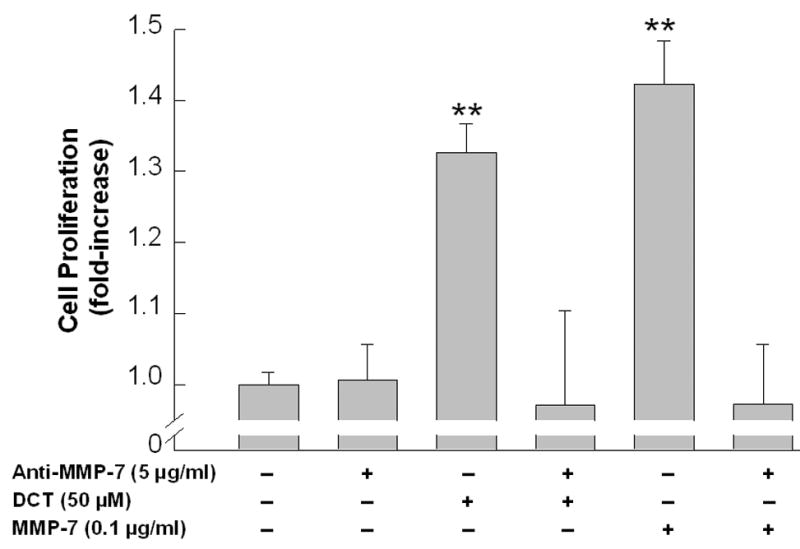
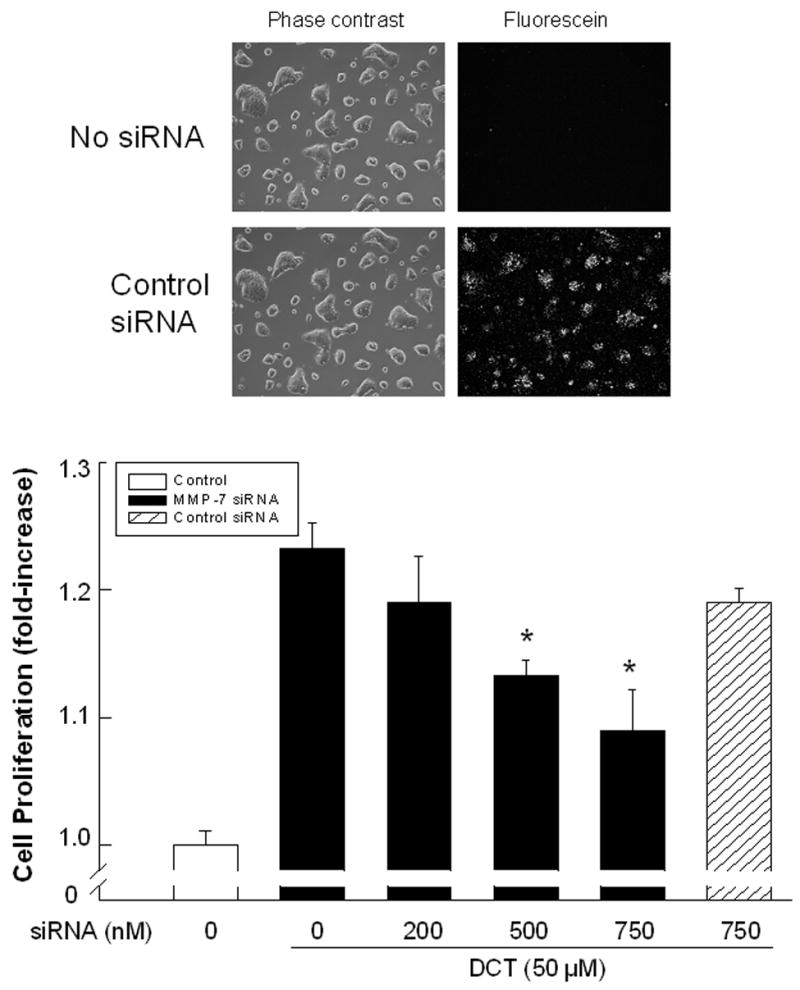
Figure 5. MMP-7 mimics the actions of bile acids on H508 colon cancer cells.


A. Effect of MMP-1 and MMP-7, alone or in the presence of an EGFR inhibitor and antibodies to EGFR and HB-EGF, on p44/42 MAPK phosphorylation. H508 cells were treated with MMP-7 (0.1 μg/ml) and MMP-1 (0.1 μg/ml), alone or in the presence of an EGFR inhibitor (PD168393, 2 μM), an anti-EGFR antibody (10 μg/ml) and an anti-HB-EGF neutralizing antibody (10 μg/ml), for 10 minutes at 37°C. p44/42 MAPK activity was determined by immunoblotting with antibodies specific for phosphorylated MAPK. The quantity of protein added was verified by immunoblotting with antibodies specific for total p42 MAPK. Results are representative of 3 separate experiments. B. Comparison of the efficacy of increasing concentrations of HB-EGF, MMP-7 and MMP-1, with that of DCT for stimulating H508 cell proliferation. Cells were incubated with increasing concentrations of MMP-7, MMP-1, and HB-EGF for 5 days at 37°C and stimulation of cell proliferation was compared to that observed with water and DCT. Results are mean ± SEM of 3 experiments. *,**P < 0.05 and 0.005, respectively vs unstimulated cells. The vertical axis (cell proliferation) is the same for the line drawing (left panel) and bar graph (right panel). C. MMP-7 antibodies inhibit the proliferative actions of MMP-7 and DCT on H508 colon cancer cells. Cells were incubated with DCT and MMP-7, alone and in the presence of antibody to MMP-7, for 5 days at 37°C. Cellular proliferation was determined by the sulforhodamine blue (SRB) colorimetric assay [33]. Results are mean ± SEM of 3 experiments. **P < 0.005 vs unstimulated cells. D. Transfection of cells with MMP-7 siRNA inhibits the proliferative actions of DCT. H508 cells were transfected with siRNA duplex oligos targeting human MMP-7 or a fluorescein-tagged nonspecific duplex oligo negative control. Two days following transfection, cells were incubated for an additional 5 days in FBS-free medium containing 50 μM DCT. The inset at the top shows cellular accumulation of fluorescent control siRNA. Cellular proliferation was determined by the sulforhodamine blue (SRB) colorimetric assay [33]. Results are mean ± SEM of 3 experiments. *P < 0.05 vs cells incubated with DCT alone.
