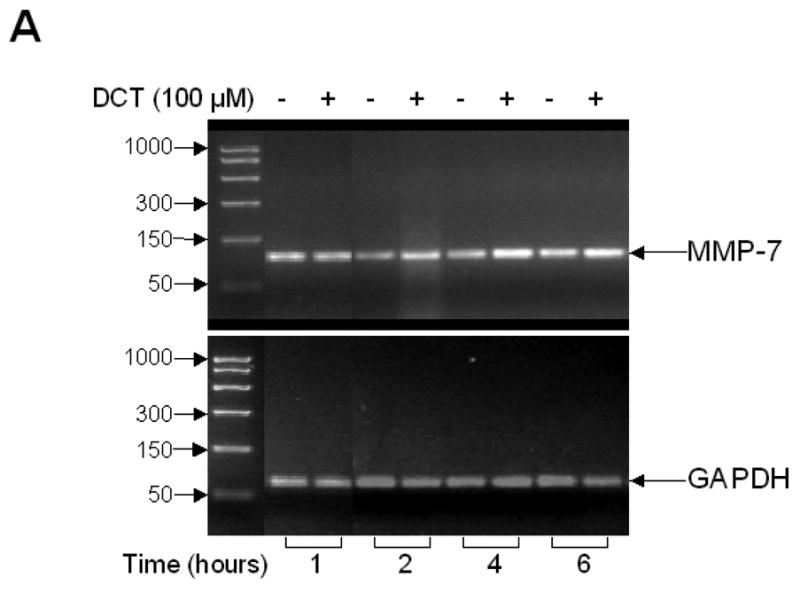
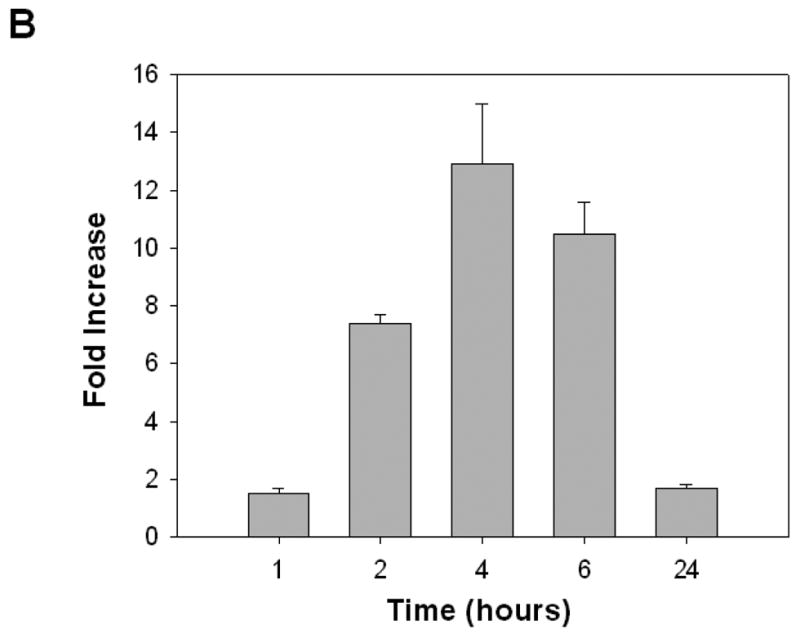
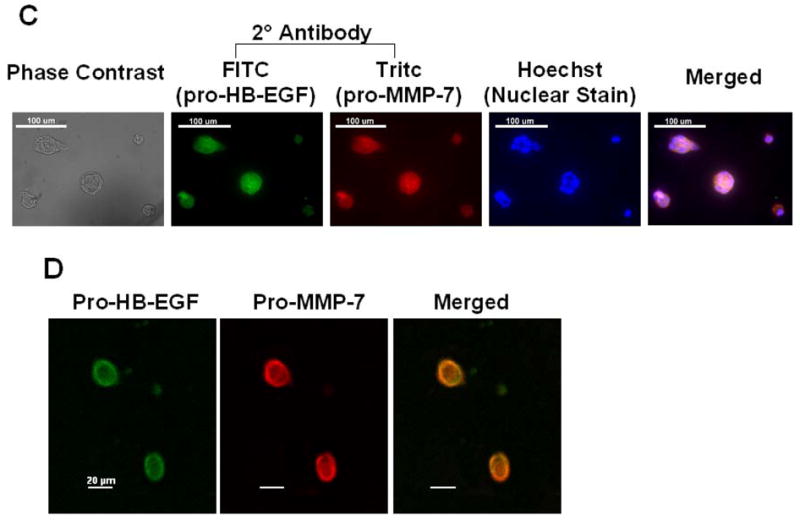
Figure 6. Expression of MMP-7 and plasma membrane co-localization of pro-HB-EGF and pro-MMP-7 in H508 human colon cancer cells.


A. Agarose gel (2%) of PCR products from quantitative reverse transcription-PCR in H508 cells confirms MMP-7 gene transcription and induction by DCT. H508 cells were cultured in serum-free media for 24 hrs prior to DCT (100 μM) treatment. Total RNA was isolated following harvest of cells at the indicated time points. DNA size markers (base pairs) are indicated at left with arrows. Arrows at right indicate PCR product for MMP-7 and the glyceraldehyde-3-phosphate dehydrogenase (GAPDH) control. B. DCT induces MMP-7 mRNA expression in H508 colon cancer cells. The level of MMP-7 mRNA was determined by quantitative real-time PCR as described in Materials and methods. Results are mean ± SEM of 3 experiments. C. Immunofluorescence microscopy. Left panel: Phase contrast microscopy of H508 colon cancer cells. Immunofluorescence localization in H508 colon cancer cells using pro-HB-EGF (FITC, green fluorescence) and pro-MMP-7 (Tritc, red fluorescence) antibodies is shown. Cell nuclei are stained with Hoechst (blue). Extreme right panel: Merged images of pro-HB-EGF, pro-MMP-7 and cell nuclei. Cytoplasmic co-localization of pro-HB-EGF and pro-MMP-7 is shown by light orange color. Scale bar = 100 μm. D. Confocal microscopy. Immunofluorescence staining of pro-HB-EGF (left, green fluorescence) and pro-MMP-7 (middle, red fluorescence) demonstrates cell surface co-localization (right, light orange fluorescence). Scale bar = 20 μm.
