
Figure 1.
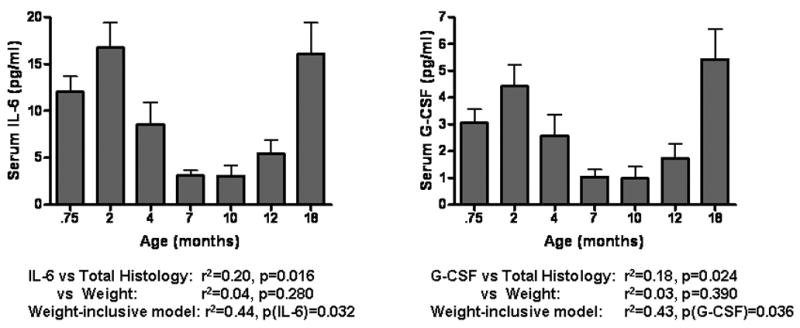
IL-6 and G-CSF serum concentrations over the entire experimental period. Note that all reported statistics refer to only the 7–18 month time period. Neither cytokine serum concentration associated significantly with weight. The p-values reported for the weight-inclusive models show that IL-6 and G-CSF significantly contribute to the models' prediction of total histology.