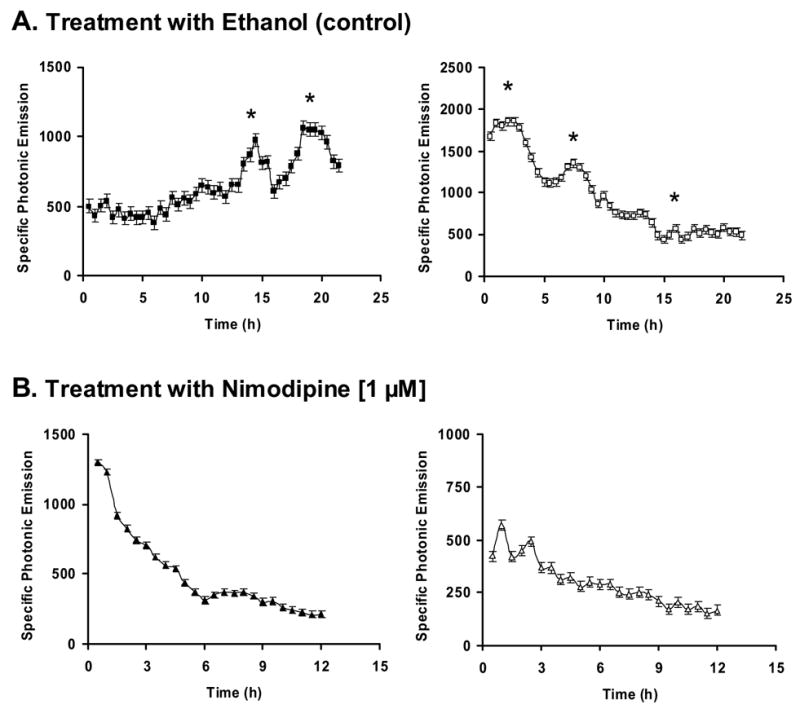
Figure 1. Effect of nimodipine on GnRH promoter pulse activity.

Representative photonic profiles measured from single GT1-7 cells microinjected with pA3GnRH-LUC and treated with either (A) 0.08% ethanol (control vehicle, n = 24 cells) or (B) 1 μM nimodipine (n = 13 cells). Two examples of expression profiles are presented for each treatment. Every point represents photonic signal accumulated for 30 min and is expressed as a function of the SNV (see Materials and methods). Vertical bars indicate SEM. Asterisks represent significant GnRH-GE pulses.
