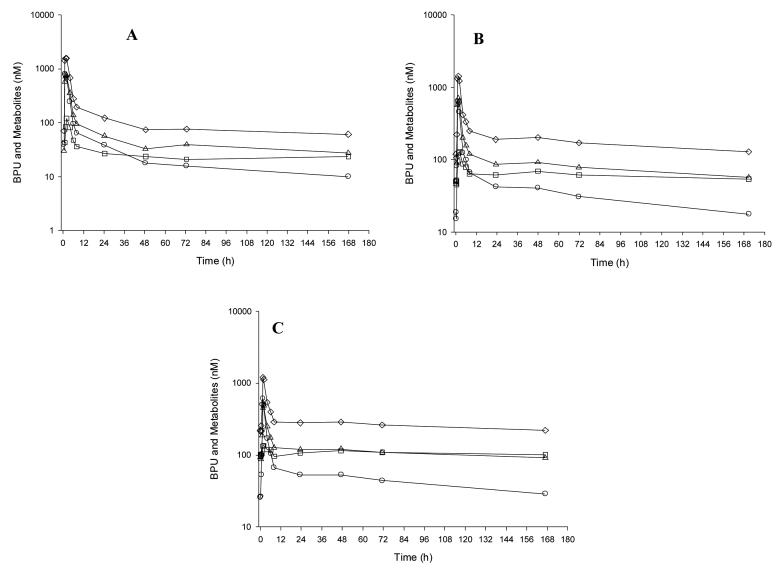
Figure 1.
Plasma concentration time curve in a single patient for BPU administered orally at a dose of 150 mg during week 1 (A), 4 (B), and 8 (C). The open circle (○), open triangle (△), open square (□) and open diamond (◇) represent BPU, mmBPU, aminoBPU, and cumulative exposure to BPU and the cytotoxic metabolites concentrations, respectively.

