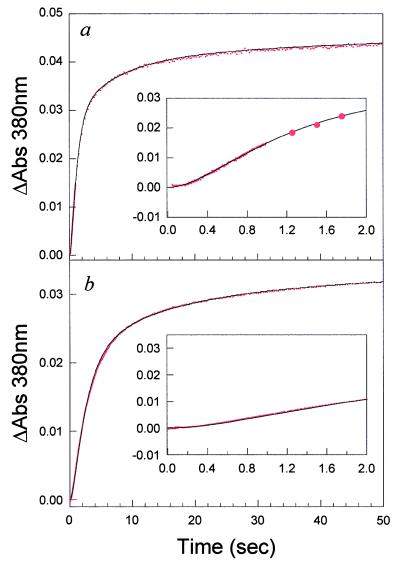
Figure 3.
(a) Plot of the difference in absorbance on methotrexate binding as a function of time for a refolding jump to 0.54 M urea. (b) Plot of the absorbance difference for a refolding jump to 2 M urea. Spectra were acquired on the Applied Photophysics SX.17MV stopped-flow unit. The change in signal was observed at 380 nm. The solid lines correspond to the simulation of the proposed four-channel folding model. Insets show the first 2 sec of the reaction. The data were collected at pH 7.80 and 15°C.

