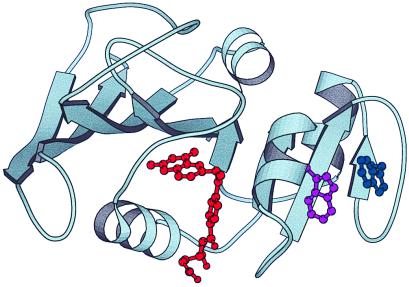
Figure 5.
Ribbon diagram of E. coli dihydrofolate reductase by using the x-ray coordinates from the Bolin et al. structure (28). The molecule is oriented to show the two subdomains with the interconnecting loops. The two tryptophans forming the exciton coupling (47 and 74) are shown in purple and blue, respectively, whereas the substrate-binding pocket is shown with the bound methotrexate in red. The program molscript was used to prepare this diagram (29).

