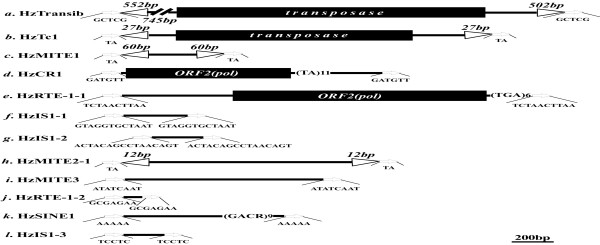
Figure 2.

Schematic structures of the 12 transposons. The structure of the 12 transposons are drawn to scale (except for Hztransib1) with horizontal arrows representing putative TSDs (sequence shown underneath). Arrowheads represent TIR (length shown above), filled black boxes represent putative ORF and black lines represent non-coding sequences. Microsatellite sequences within some transposons are shown in parentheses, followed by the corresponding repeat number.
