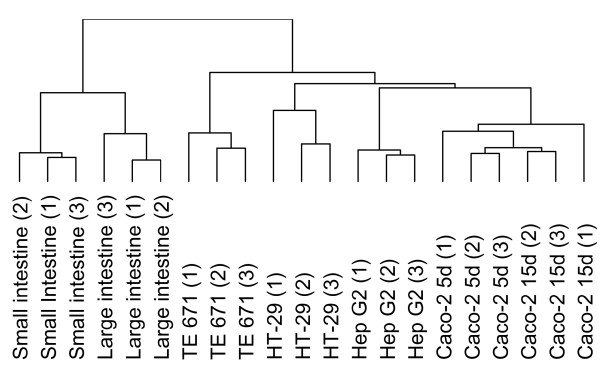
Figure 1.

Unsupervised hierarchical clustering of protein profiles. A dendogram, generated by unsupervised hierarchical clustering of protein expression data of 2-D profiles of protein isolates obtained from three biological replicates of small intestinal scrapings, partially and fully differentiated Caco-2 cells, HT-29 cells, Hep G2 cells and TE 671 cells. Profiles of large intestine (1) and (2) come from one human sample.
