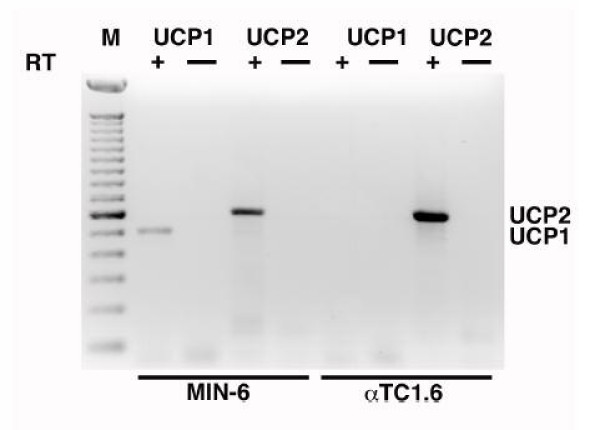
Figure 2.
Ucp1 is expressed in an insulin producing cell line: cDNAs prepared in the absence or presence of reverse transcriptase (RT) from total RNA isolated from MIN-6 and αTC1.6 cells, were used for PCR with the indicated primers. The lane containing 100 bp marker (M), and positions of Ucp1 and Ucp2 products are indicated. A band corresponding to Ucp1 (505 bp) can be clearly seen in the lane corresponding to RT+ MIN-6 cDNA. Expression of Ucp2 (608 bp) can be seen in both insulin and glucagon producing cell lines.

