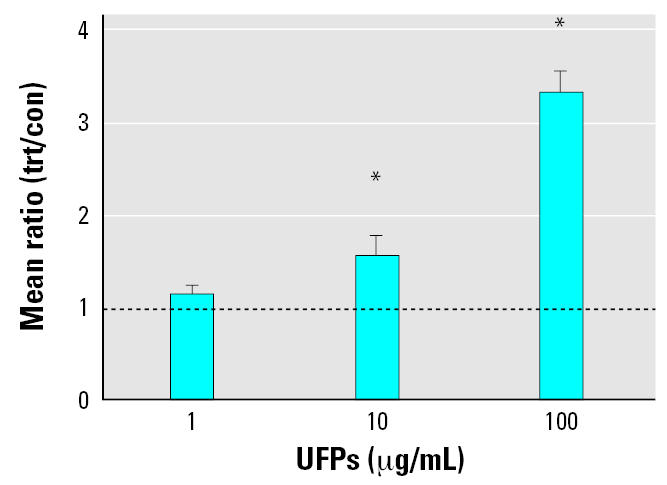
Figure 1.

Q-PCR gene expression of tissue factor (F3) in cell cultures exposed to UFPs (1, 10, and 100 μg/mL) for 4 hr. n = 4 additional experiments for each timepoint and particle exposure. The line indicates a mean ratio of 1.0 or no fold change between treated (trt) and control (con) samples. Error bars indicate mean ± SE. Statistical significance was determined with the paired t-test.
*Significantly different from control samples, at p < 0.05.
