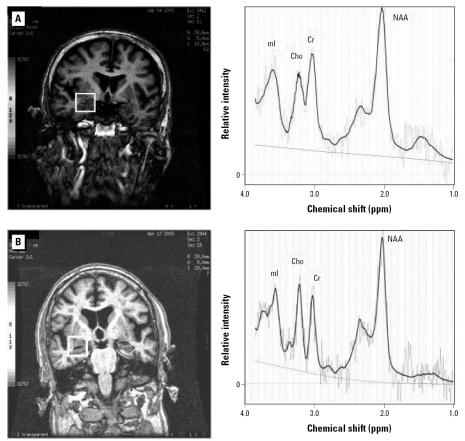
Figure 1.
Example MRI and magnetic resonance spectroscopy spectra from participants in the low (A) and high (B) bone lead groups. The left panels show the region of interest outlined by a thick white box overlying the right hippocampal region on the MRIs. The right panels show the accompanying spectra with peaks for mI, Cho, Cr, and NAA indicated.

