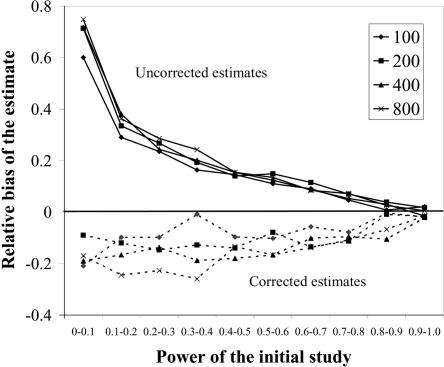
Figure 2. .
Bias of the uncorrected and corrected estimates of the additive genetic effect. For each of the sample sizes, the data set has been stratified into 10 categories of power indicated on the horizontal axis. The vertical axis indicates the average relative bias observed in each power category. We performed simulations with four sample sizes, as indicated by the legend. The solid lines show the bias of estimates of penetrance parameters that were generated without correction for ascertainment, whereas the dashed lines show the bias of estimates generated while correcting for ascertainment.

