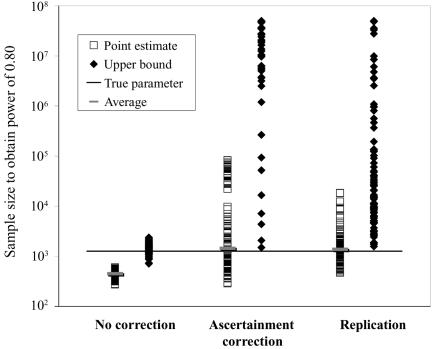
Figure 4. .
Estimated sample size for a replication study. We used the 100 parameter estimates for the low-powered study described in figure 1 to calculate the sample size required to achieve 0.80 power for α=10-6 in a replication study. The vertical axis indicates the calculated sample size, and the horizontal axis shows the method used to estimate the sample size; the squares represent results based on point estimates; the diamonds show results based on upper 95% bounds. The horizontal line shows the actual required sample size (1,261), and the short horizontal bars display the average of each set of point estimates.

