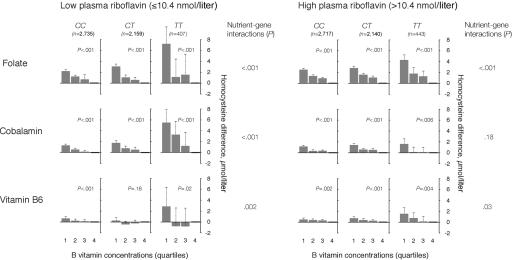
Figure 2. .
B vitamins as determinants of plasma tHcy according to riboflavin concentrations and MTHFR 677C→T genotype. The population was stratified according to levels of plasma riboflavin (below and above the median) and MTHFR 677C→T genotype. The folate-tHcy, cobalamin-tHcy, and vitamin B6–tHcy relationships were then studied in a regression model, which included these vitamins in addition to sex, age, creatinine, and study center. Means with upper limits of 95% CIs and P for trend across quartiles are shown in each panel. Nutrient-gene interaction terms were calculated as the product between MTHFR genotype and the various B vitamins.

