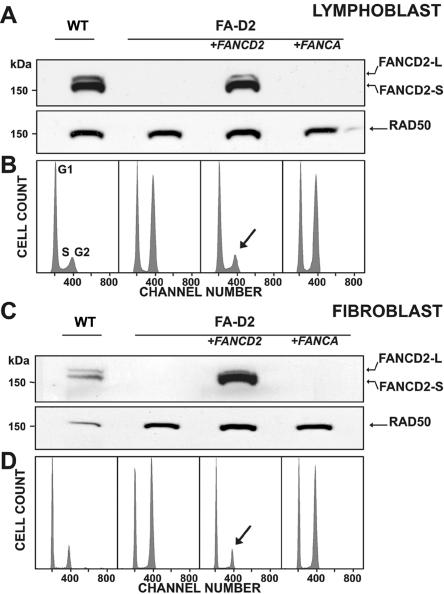
Figure 2. .
Delineation of FA-D2. A, Assignment to group FA-D2 on the basis of the absence of either FANCD2 band on immunoblots after exposure of the patients’ cells to MMC, here shown for an LCL from patient 6 (lane 2). Transduction with FANCD2 cDNA with use of S11FD2IN restores both isoforms of FANCD2—S and L (lane 3)—similar to a nontransduced normal control (lane 1). Transduction with FANCA cDNA in the same vector fails to show such restoration (lane 4). B, Assignment to group FA-D2 on the basis of cell-cycle analysis. After exposure to MMC, the LCL of the same patient shows pronounced G2-phase arrest (56.6%) (lane 2; Hoechst 33342 staining). Transduction with FANCD2 cDNA by use of S11FD2IN reduces the G2 phase to normal (14.9%) (lane 3, arrow), similar to the nontransduced normal control (16.6%) (lane 1). Transduction with FANCA cDNA in the same vector fails to reverse the G2-phase arrest (53.1%) (lane 4). Panels C and D are analogous to panels A and B and show complementation with cultured fibroblasts from patient 10; staining in panel D was with 4',6-diamidino-2-phenylindole (DAPI). G2-phase proportions in panel D are 20.3% (lane 1, control), 61.3% (lane 2, nontransduced FA), 19.9% (lane 3, FANCD2-transduced FA), and 58.5% (lane 4, FANCA-transduced FA). RAD50 [MIM 604040] was used as the loading control in panels A and C. WT=wild type.

