
Figure 2.
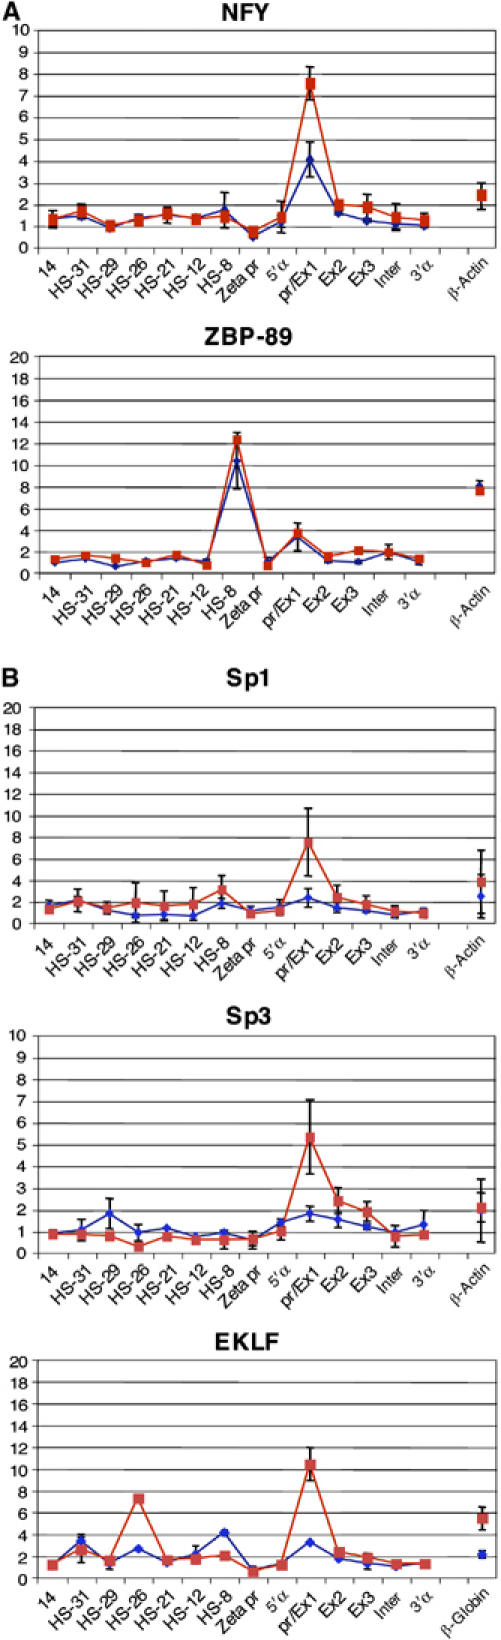
Recruitment of NFY and ZBP-89 (A) and Sp/X-Kruppel-like transcription factors (B) at the mouse α globin core promoter. Real-time PCR analysis of immunoprecipitated chromatin using the antibodies indicated in uninduced (blue) and induced (red) MEL cells. The y-axis represents enrichment over the input DNA, normalised to a control sequence in the GAPDH gene. The x-axis represents the positions of Taqman probes used. The coding sequence is represented by the three exons (promoter/Ex1, Ex2 and Ex3) of the α globin genes. Inter refers to the intergenic region (between α1 and α2). Negative controls 5′α and 3′α flank the α globin gene. β-Actin and β globin denote control sequences at the mouse β-actin gene and β globin promoter, respectively. Error bars correspond to ±1 s.d. from at least two independent ChIPs. Similar data were obtained from primary cells (Supplementary Figure S2).