
Figure 2.
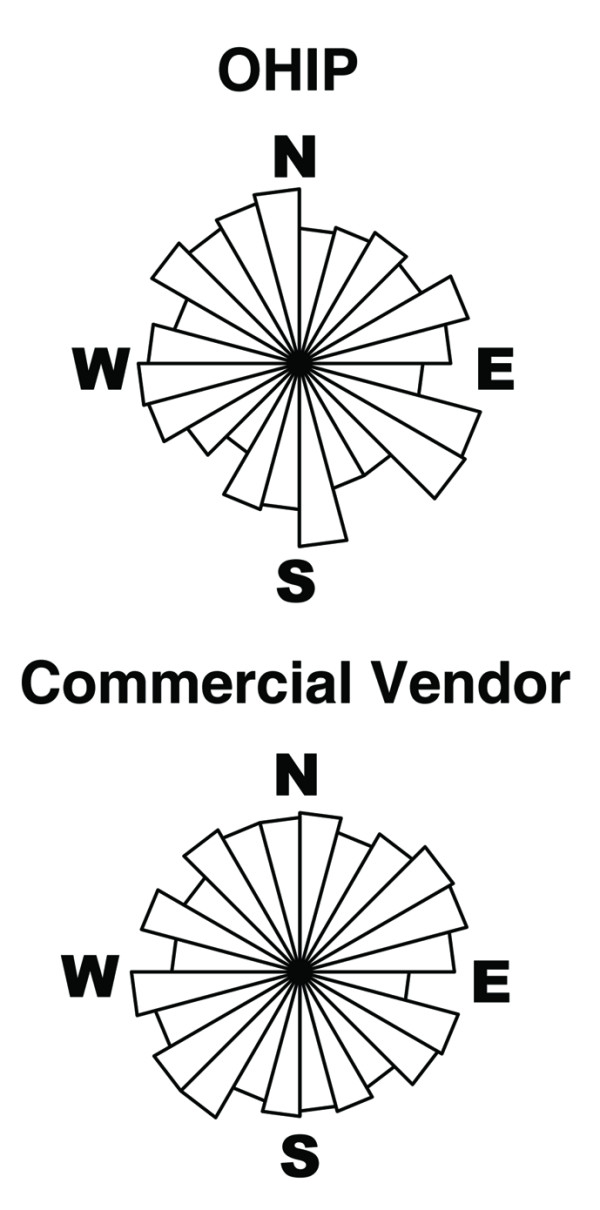
Distributions of Geocode Location Error Angles. Rose plots portraying the distribution of angles between the geocode and the residence (using 15° bins) for OHIP and commercial vendor geocodes.
Official websites use .gov
A
.gov website belongs to an official
government organization in the United States.
Secure .gov websites use HTTPS
A lock (
) or https:// means you've safely
connected to the .gov website. Share sensitive
information only on official, secure websites.
Distributions of Geocode Location Error Angles. Rose plots portraying the distribution of angles between the geocode and the residence (using 15° bins) for OHIP and commercial vendor geocodes.