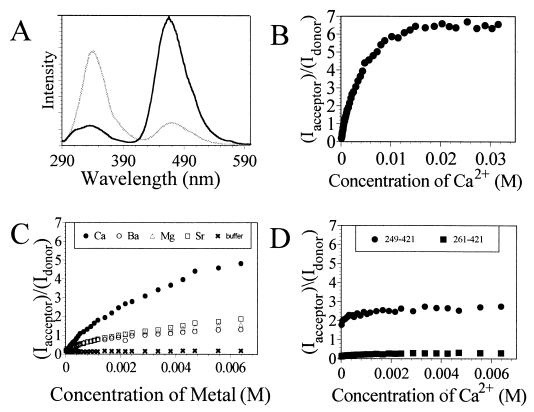
Figure 2.
Fluorescence resonance energy transfer analysis of calcium-induced conformational changes within synaptotagmin. (A) Steady-state emission spectra of coumarin-labeled synaptotagmin before (gray line) and after (black line) exposure to ≈32 mM Ca2+. Fluorescence experiments were performed with 5 μM synaptotagmin in 10 mM Bis⋅Tris and 100 mM KCl (pH 7.0) by using an excitation wavelength of 280 nm. (B) Plot showing the ratios of the coumarin/tryptophan peak emission signals for synaptotagmin as a function of Ca2+ concentration. (C) Comparative plot showing the ratios of the coumarin/tryptophan peak emission signals for synaptotagmin as a function of Ca2+, Ba2+, Mg2+, and Sr2+ concentrations relative to buffer only (baseline). (D) Comparative plot showing the ratios of the coumarin/tryptophan peak emission signals for syt249–421 and syt261–421 as a function of calcium. Both truncated proteins show calcium-independent behavior; only the protein that contains W259 exhibits significant energy transfer to coumarin.

