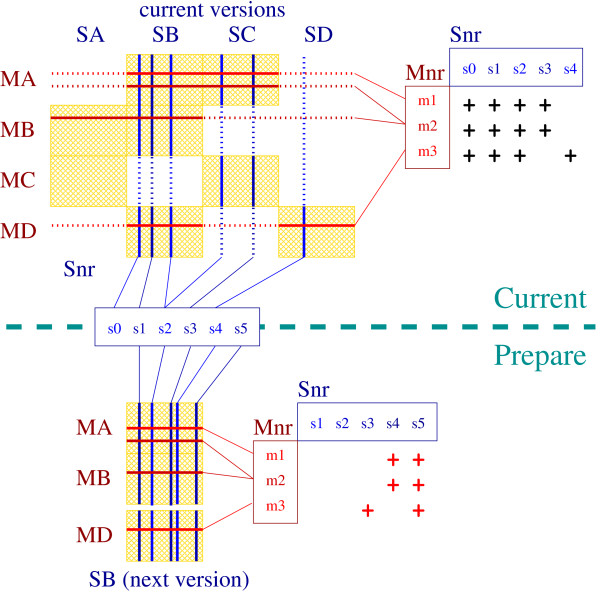
Figure 3.
Example of redundancy management. This example [9] uses four motif (MA ... MD) and four sequence databases (SA ... SD). The upper part of the figure corresponds to all data that are currently in production. The table on the upper left represents the different databases and some of their individual entries (horizontal and vertical lines). A yellow rectangle symbolizes a subscription for computation. The small table on the right-hand side represents five "non-redundant" sequences ("Snr", arranged in columns) and three motifs ("Mnr", in rows). The computations between individual sequences and motifs are symbolised with black crosses; these do not necessary signal the presence of a match, but indicate the fact that the necessary calculations have been performed. - The bottom part of the figure shows a new version of sequence database SB that is being prepared to replace the current version. Sequence s0 will be deleted from database SB, sequence s5 will be inserted, s3 and s4 are new to SB but already present in other databases. The computations that must be performed are indicated by the red crosses. Note that there is no need to compute s4 against m3, since it was already present in SD which, in turn, is already subscribed to MD. - The same principle applies for updating a database of motifs.

