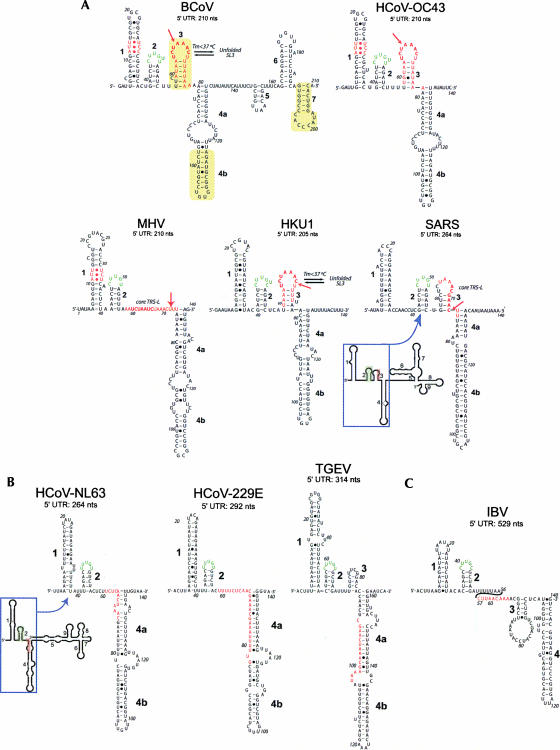
FIGURE 1.
(A) Predicted secondary structure models for the entire 5′ UTR of BCoV compared with the 5′ 140 nt of selected group 2 coronaviruses. (B) Predicted secondary structure models for three group 1 coronaviruses. (C) Predicted secondary structure model of a group 3 coronavirus, avian infectious bronchitis virus (IBV). (Bold numbers) Predicted stem–loops SL1, SL2, SL3, and SL4 (4a and 4b), (bold red letters) leader TRS-L sequences, (yellow) SL-II, SL-III, and SL-IV of Raman et al. (2003) and Raman and Brian (2005). Nucleotide positions are numbered according to GenBank accession numbers (BCoV-LUN: AF391542; HCoV-OC43: NC_005147; MHV-A59: NC_001846; HKU1: NC_006577; SARS-CoV: NC_004718; HCoV-NL63: NC_005831; HCoV-229E: NC_002645; TGEV: NC_002306); IBV: NC_001451). All models except one represent mfe structures, and are predicted by Mfold, PKNOTS, and ViennaRNA. The lone exception is MHV, which represents a structure within 1.7 kcal mol−1 of the mfe structure. If SL2, the strongest secondary structure in a covariation analysis (not shown), is forced to pair as indicated, the structure shown represents the mfe structure.

