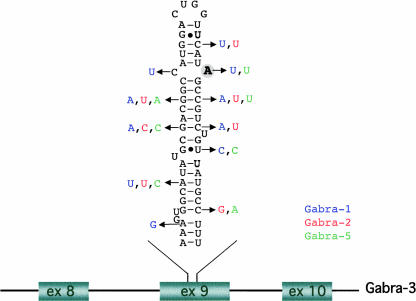
FIGURE 1.
Subunit-specific sequences of the gabra genes. The predicted structure of the stem–loop within exon 9 of Gabra-3. The edited A is printed in bold and circled in gray. The differences between Gabra-3 and other Gabra sequences are shown in blue for Gabra-1, red for Gabra-2, and green for Gabra-5.

