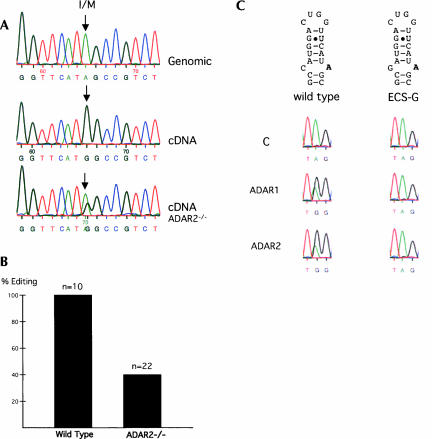
FIGURE 2.
Editing of the Gabra-3 transcript. (A) The editing of Gabra-3 was demonstrated by DNA sequencing. The chromatogram of the genomic DNA sequence shows an adenosine at the I/M-site, indicated by an arrow. Total brain RNA from the same NMRI adult mouse was reverse transcribed (cDNA) and sequenced after PCR amplification. A guanosine was present at the I/M site in the cDNA. The cDNA from an ADAR2−/− adult mouse was amplified by PCR and sequenced. A dual A and G peak appeared with the majority of the transcripts showing an A at the I/M site. (B) PCR products from wild-type and ADAR2−/− cDNA were cloned and sequenced. The sequences of 10 wild-type and 22 ADAR2−/− clones were determined. (C) Wild-type Gabra-3 and Gabra-3 with a mutated ECS (ECS-G) were transfected into HEK 293 cells with an ADAR1 or ADAR2 expression vector. An empty expression vector (labeled “C” for control) was used as a control for endogenous editing. In wild-type Gabra-3 (left), no editing was observed in the control since a single A peak is seen at the I/M site. During cotransfection with ADAR1 or ADAR2 dual G/A peaks were seen with the majority in the G peak. Adenosine was present at the editing site in the ECS-G mutant in all transfection experiments (right).

