
Figure 1.
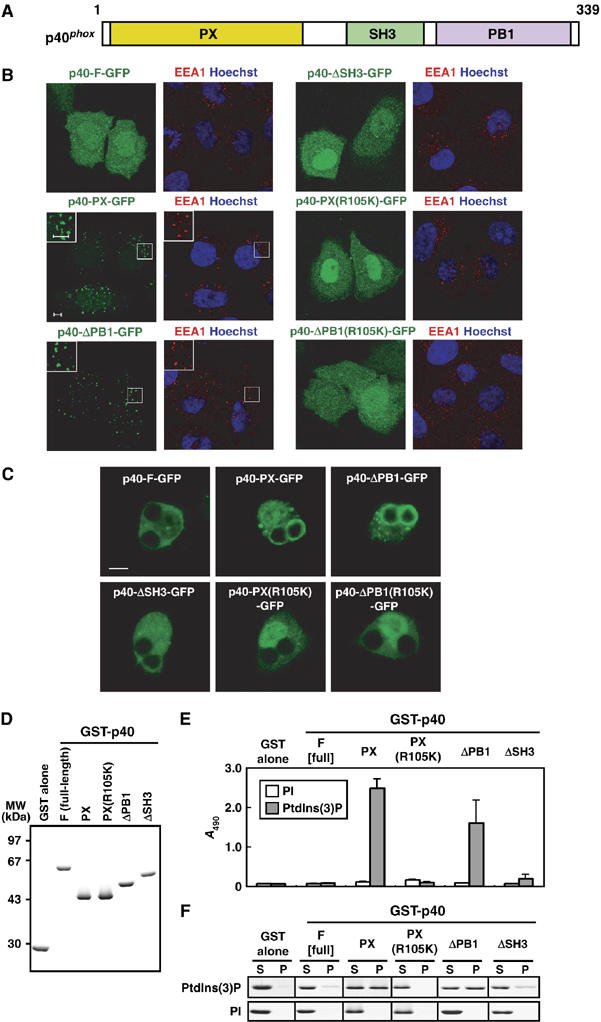
Role of the PB1 domain in p40phox binding to PtdIns(3)P. (A) A schematic diagram of p40phox. The PX, SH3, and PB1 domain are colored in yellow, green, and magenta. (B) Subcellular distribution of p40phox and its truncated proteins in transiently transfected HeLa cells. Left panel, distribution of GFP-tagged p40phox in fixed HeLa cells (green); right panel, distribution of endogenous EEA-1 (red) and Hoechst staining of the nucleus (blue) in the same field of fixed HeLa cells. The insets show the magnified views. Scale bar, 5 μm. (C) Localization of ectopically expressed p40phox and its truncated proteins in RAW264.7 cells ingesting IgG-coated beads. Scale bar, 5 μm. (D) SDS–PAGE analysis of GST-tagged p40phox proteins used in the following lipid-binding assays (E, F). Proteins were stained with Coomassie brilliant blue. (E) ELISA-format lipid-binding assay. Each well of a titer plate coated with phospholipids containing 10% of PI or PtdIns(3)P was incubated with the indicated p40phox proteins. The bound proteins were stained as described under Materials and methods. Each value represents the mean of data with bars representing s.d. in more than three independent experiments. (F) Co-sedimentation assay with liposomes. Liposomes containing 5% of PI or PtdIns(3)P were incubated with the indicated p40phox proteins. After centrifugation, proteins in the supernatant (S) and precipitate (P) fractions were analyzed by SDS–PAGE. The experiments have been repeated more than three times with similar results.