
Figure 2.
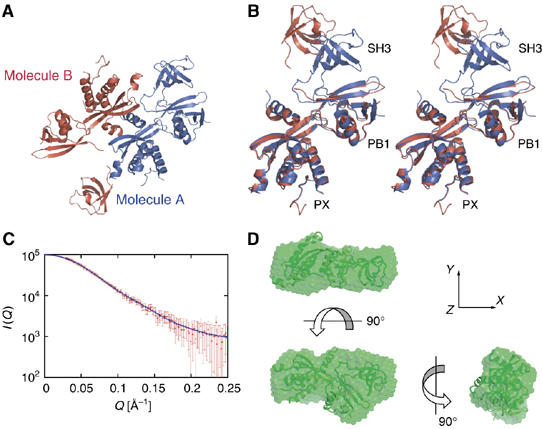
The overall structure of p40phox. (A) Structure of the two molecules of p40phox in the asymmetric unit. Molecule A, which has a clear electron density, is colored blue, and molecule B, which has a poor electron density, is colored red. (B) A stereo pair of a ribbon diagram of p40phox. Molecule B is superimposed onto Molecule A by the PX domain. Each molecule is color coded as in (A). (C) Experimental and calculated small-angle X-ray scattering curves for p40phox. The smooth curve in red corresponds to the scattering curve calculated from the dummy atom model derived using the program DAMMIN, which is superposed on the experimental curve (dots with error bars). (D) The crystal structure of p40phox (Molecule A, ribbon diagram) is superimposed onto the low-resolution model restored by the DAMMIN, shown as green surface representation. The right model is rotated by 90° around the y-axis and the upper model is rotated by 90° around the x-axis according to the arrows.