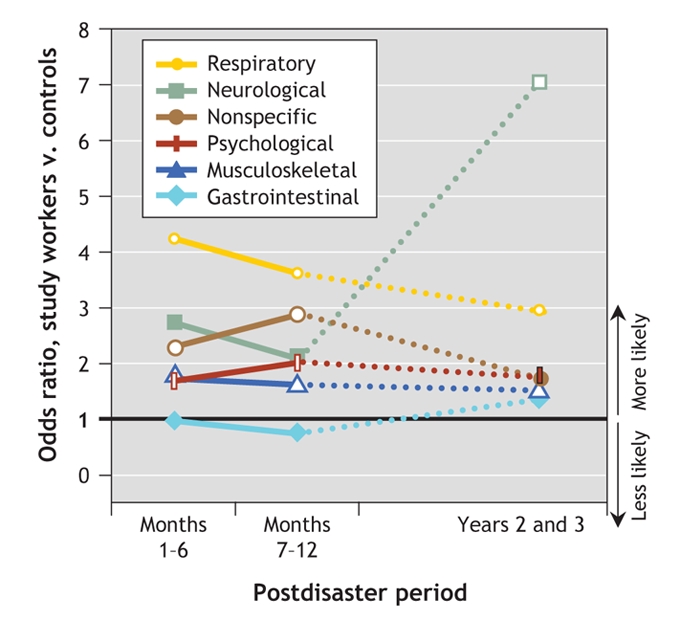
Fig. 1: Odds ratios for prevalences of sick leave, comparing the percentages of study workers who took sick leave against those of control workers. Results shown are for 6 health-related clusters of reasons why rescue workers were absent from work. Open (white-centred) symbols show statistical significance.
