Fig 1.
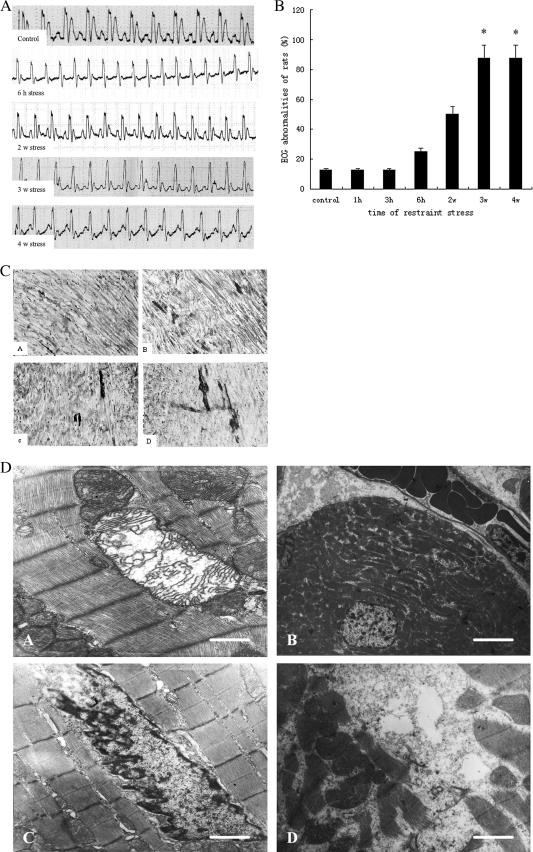
Pathological alterations of myocardial function and ultrastructure in stressed rat. (A) Changes in electrocardiography of restraint-stressed rats. Rats were anesthetized with 1% sodium pentobarbital (45 mg/kg) by intraperineal injection and kept in a supine position. Limb-lead electrocardiography (ECG) was recorded with an 8-channel physiological recorder. The results showed that abnormalities in the ECG were detected in stressed groups. The elevation in slope or level of ST segment and the two-way of T-wave occurred in groups stress for 2 and 3 weeks, but the elevation in slope of ST segment was much more obvious and the typical inversion or corona of T-wave was found in group 4 weeks after stress. (B) Changes of cardiac function in restraint-stressed rats. The results showed that ECG abnormalities began to rise after restraint for 6 hours, and that the risk of abnormality increased with the prolongation of the restraint time. In groups restrained for 3 and 4 weeks, ECG abnormalities were significantly higher (P < 0.05) than those in the control group. (C) Early pathological change in myocardium of stressed rats by acid fuchsin staining. Acid fuchsin–positive cells were defined as those staining bright red, clearly distinct from the green staining of the control, with the stained areas and intensity representing the severity of injury. Pathologic tissue slices showed that acid fuchsin–positive cells gradually increased as the durations of stress were prolonged. a: control; b: stress for 2 weeks; c: stress for 3 weeks; d: stress for 4 weeks. (D) Changes of myocardial ultrastructure in stressed rats by electron microscopy. The left ventricular muscle (1 mm3) from restraint-stressed rats was ultrathin sectioned and stained after routine treatment and then was examined on the electron microscope. Micrographs showed that changes of myocardial ultrastructure occurred in chronic stress groups. a: mitochondrial swelling and interrupted cristae, the bar in the lower right panel represents 0.9 μm; b: erythrocyte congestion in peripheral vasculature, bar = 5 μm; c: nuclear membrane shrinkage and chromatin margination; d: myofibril breakage, bar = 1.5 μm, which has the same magnification as c

