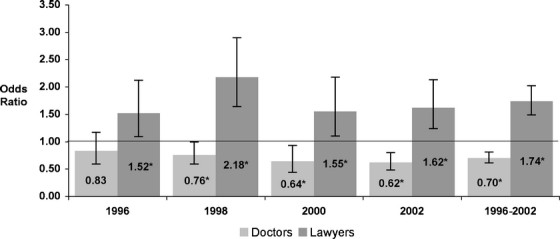
Figure 1.

Adjusted odds of voting of physicians and lawyers compared to the general population from 1996 to 2002. P values for physicians compared to the general population: 1996, P = .3; 1998, P = .045; 2000, P = .018; 2002, P < .001; and 1996–2002, P < .001. P values for lawyers compared to the general population: 1996, P = .015; 1998, P < .001; 2000, P = .012; 2002, P < .001; and 1996–2002, P < .001. Statistical significance is denoted in the figure with an asterisk for P < .05.
